How we scale our microVM infrastructure using low-latency memory decompression
Moving from raw memory snapshots to compressed memory snapshots, and the optimizations for the challenges that follow

With CodeSandbox, you can turn your repository into a shareable development environment that's available 24/7. Give it a try with this Next.js example or import your GitHub repo!
Over the past few years (oof, time flies!) I've written two blog posts about how we quickly clone and resume microVMs. You can find those two blog posts here:
Today, I'm adding a third post to the series! This time, I'll talk about how we efficiently store memory snapshots for VMs, and how we lazily load them to resume VMs within a second.
Quick recap
Before diving into the new article, let's briefly revisit the key points from the previous posts. If you're already familiar with them, feel free to skip ahead!
At CodeSandbox we allow you to write code in an online code editor and share that running code with the world in so-called “Devboxes”. People can clone these Devboxes and play with the code themselves.
All of these Devboxes are backed by microVMs, and over 150,000 new microVMs are created on a monthly basis on CodeSandbox. To ensure that 1) we can provide a fast experience and 2) our hosting costs don't explode, we've developed a live clone & resume technology for those VMs.
Imagine you're sharing your Devbox with a colleague. As soon as they click "Fork," we live-clone the underlying VM, providing them with their own isolated environment to tinker with. Then when they are inactive or away for more than 5 minutes, we snapshot the memory of that VM, and when they come back we resume from that snapshot within 1 second.
In the last two posts I've written about how we clone a VM quickly. In summary, we use a Linux feature called userfaultfd which allows us to control how a VM loads its memory. Whenever a cloned VM tries to access a piece of memory for the first time (generating a pagefault), we intercept that request, initialize the memory, and allow the request to come through. This feature is the foundation of our VM cloning & snapshot/restore functionality.
Now let's talk about memory snapshots!
Why memory snapshots?
Running VMs can get expensive, which is why many cloud services have an inactivity timer. In essence, if you're not using a VM for x minutes, the service shuts down the VM.
At CodeSandbox we do the same, but instead we hibernate the VM and create a memory snapshot. Now when we resume the VM, it will continue exactly where it left off doing the things it was doing. Similar to closing your MacBook and opening it later.
This is specifically beneficial for development environments, because those environments run processes that take a while to initialize (dev servers, LSPs). Also, because we can resume a VM within a second, we can be fairly aggressive with our inactivity timer. For our free users we hibernate already after 5 minutes of inactivity, which is a huge cost saving for our infra.
You won't notice that a VM was hibernated, because as soon as you make an HTTP request to a hibernated VM, we wake the VM and it feels as if the VM was never hibernated to begin with!
Scaling problems
The question is, does this scale? When we first deployed our snapshotting technology, it “scaled” beautifully! We were only running about 500 VMs on a monthly basis.
500 VMs is doable. Let's say every VM has 4GiB of memory, and we create a memory snapshot whenever it becomes inactive. For 500 VMs, we'd have to store 500 * 4GiB = 2,000GiB of snapshots.
However, our usage has grown, and with that came the growing pains. At this point, we run ~250,000 unique VMs on a monthly basis. If we would apply our same calculation, we would need to store 250,000 * 4GiB = 1,000,000GiB, or about 1,000TB of data. Even if we delete memory snapshots after a week, we'd have to store 320TiB of snapshots. It's too much storage, especially when you have to store those snapshots on NVMe drives for low-latency access.
Storage is not the only bottleneck. We hibernate approximately 15 VMs per minute, which means that we're also writing 15 snapshots of 4GiB per minute to disk. That's 1GiB/s constant writing to disk, just for memory snapshots.
It's time to look into compressing memory snapshots, but how can we do this while maintaining quick resume times?
Low-Latency memory decompression
It turns out that memory snapshots are pretty compressible! An 8GiB memory snapshot (for a standard Next.js example VM) compresses to 412MiB using zstd compression, almost a 20x compression ratio. Not bad!
But we can't just compress the memory snapshot and call it a day. Decompressing a memory snapshot takes between 4 and 10 seconds, assuming the server is idle. If we decompress the entire snapshot before resuming a VM, it would drastically slow down the VM's resume time.
No, to make this work, we need to decompress the memory snapshot as the VM accesses the memory, on the fly. That's easier said than done. When you compress a piece of data, you cannot say “let me read just these 4KiB from this data” without fully decompressing that data.
Let's chunk it up
To solve this, we took some inspiration from btrfs.
btrfs is a modern filesystem that allows you to automatically compress your data, transparently. You can save files to its filesystem, and btrfs will automatically compress those files before saving them to disk.
They had the same compression challenge. You can't store a whole file compressed, because decompression would add significant latency to reading files. Their solution: chunking.
btrfs saves data in small chunks (of 128KiB) and compresses those little chunks. This means that when you want to read a little bit of data from a file, it will only have to decompress the corresponding 128KiB chunk to read it.
This makes random-access reads much faster, but it also negatively affects compression ratio. Compression just isn't as efficient if it has less data to deduplicate.
We use the same approach for our memory snapshots. We “split” the memory snapshot up into little chunks of 8KiB (which is equivalent to two memory pages of 4KiB) and compress those chunks with lz4. We then store those compressed chunks instead of the raw memory data.
I've tested many chunk sizes (4KiB, 8KiB, 16KiB, 32KiB, 64KiB, 128KiB, 2MiB) before settling on 8KiB. 8KiB gives the best trade-off in terms of compression ratio and decompression speed.
This worked well! And the compression is still very impressive: the same previous snapshot of 8GiB became 745MiB (whereas with full compression, it's 412MiB). That's still a 10x size decrease! But how do we now actually load this memory snapshot from a VM?
Decompressing memory on the fly
As you might've read from the previous article, we're using the userfaultfd mechanism to control how memory inside a VM is loaded. In a nutshell, it works like this:
- When the VM reads a memory page that has not been loaded yet, it generates a pagefault. Linux pauses the VM, and notifies us that a pagefault has occurred.
- We receive that notification, and are given the chance to initialize that memory. In this case, we will decompress the corresponding memory chunk, and copy the decompressed memory to the shared memory of the VM on the location where the pagefault occurred.
- We notify Linux that it can resume the VM, and the VM will happily read its memory from the shared memory.
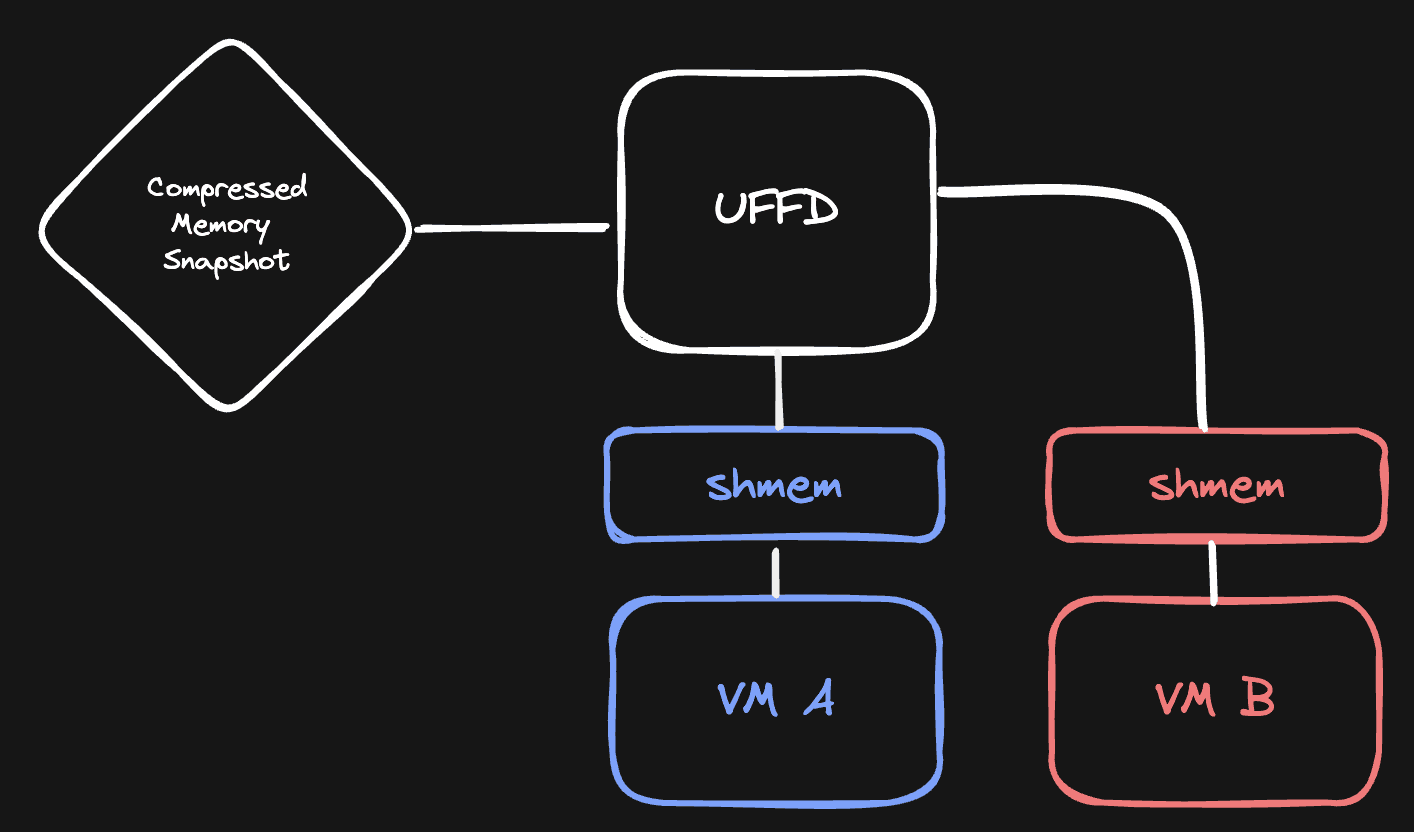
After building this logic, I took a compressed snapshot of a VM, resumed it from the snapshot, and... it worked! But it did take 4 seconds to resume, whereas a raw snapshot takes 300ms to resume.
I've created a little benchmark tool that measures how fast a snapshot can be loaded. It works with recordings: when we resume a VM, we keep track of what memory it needs to read to resume. We store this recording, and our benchmarking tool uses that information to simulate reading the same patterns. Now we can measure how fast we can load a snapshot across different strategies:
$ uffd-handler bench bench.json

metric: handle_read, count: 20662, total_time: 6.483319842s, avg: 313.779µs, min: 680ns, max: 29.851964ms
Average: 82.21MiB/s
So, we can load a memory snapshot with 82.21MiB/s if we read as fast as we can.
Still, 300ms to 4s for resuming a VM is a huge performance hit, it's too much. So let's dive into what we did to reduce those 4 seconds to 400ms.
Getting rid of sparsification
Here's one challenge with memory chunk compression: when the VM wants to read page 3, how do we know from where to read that data in the memory snapshot? Initially, we solved this using sparsification.
When we save memory chunks to a memory snapshot, we leave holes between those chunks to ensure that pages are still aligned to their original (decompressed) position. These holes do not take space, so we still get our disk space savings. This image explains how it works:
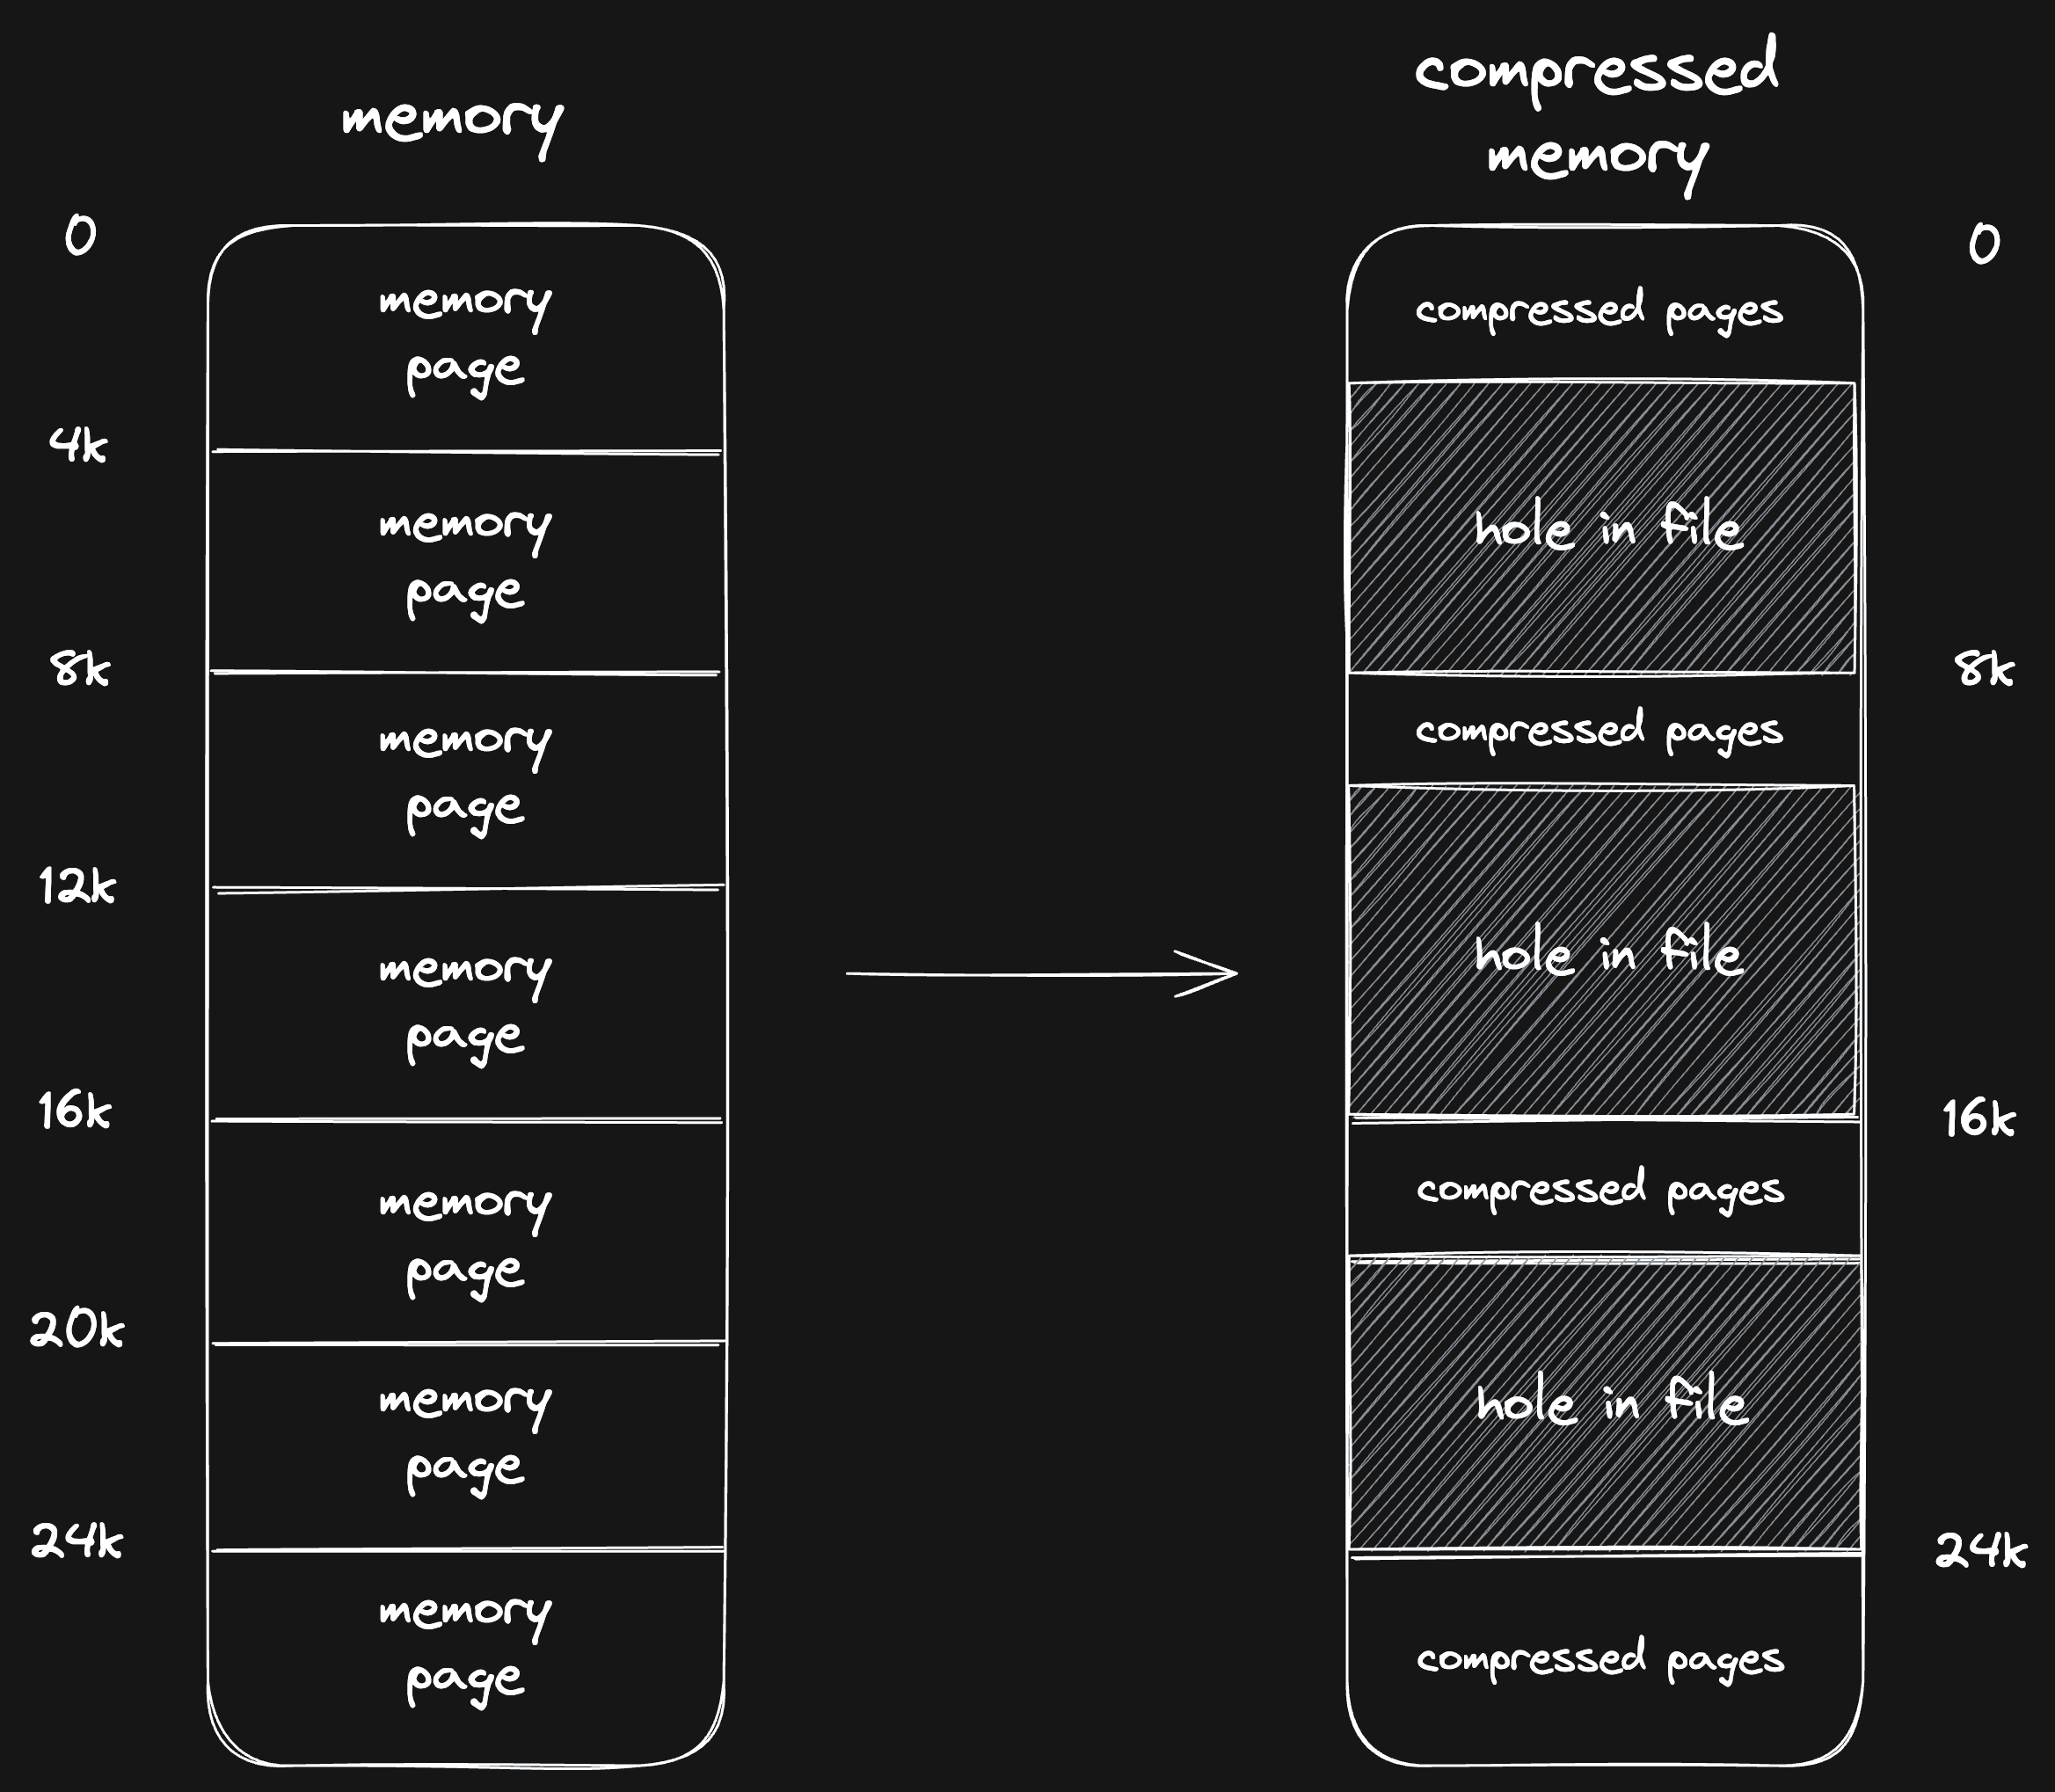
When we need to read page 2, we know to decompress the memory chunk at location 8k in the file to get it.
Unfortunately, this approach has a performance penalty. Our filesystem (btrfs) doesn't perform well with sparse files, so random access reads slow down significantly.
To solve this, we have to store memory snapshots concatenated without any holes between chunks. This means we need to know from which offset to read pages from, so we introduced memory metadata.
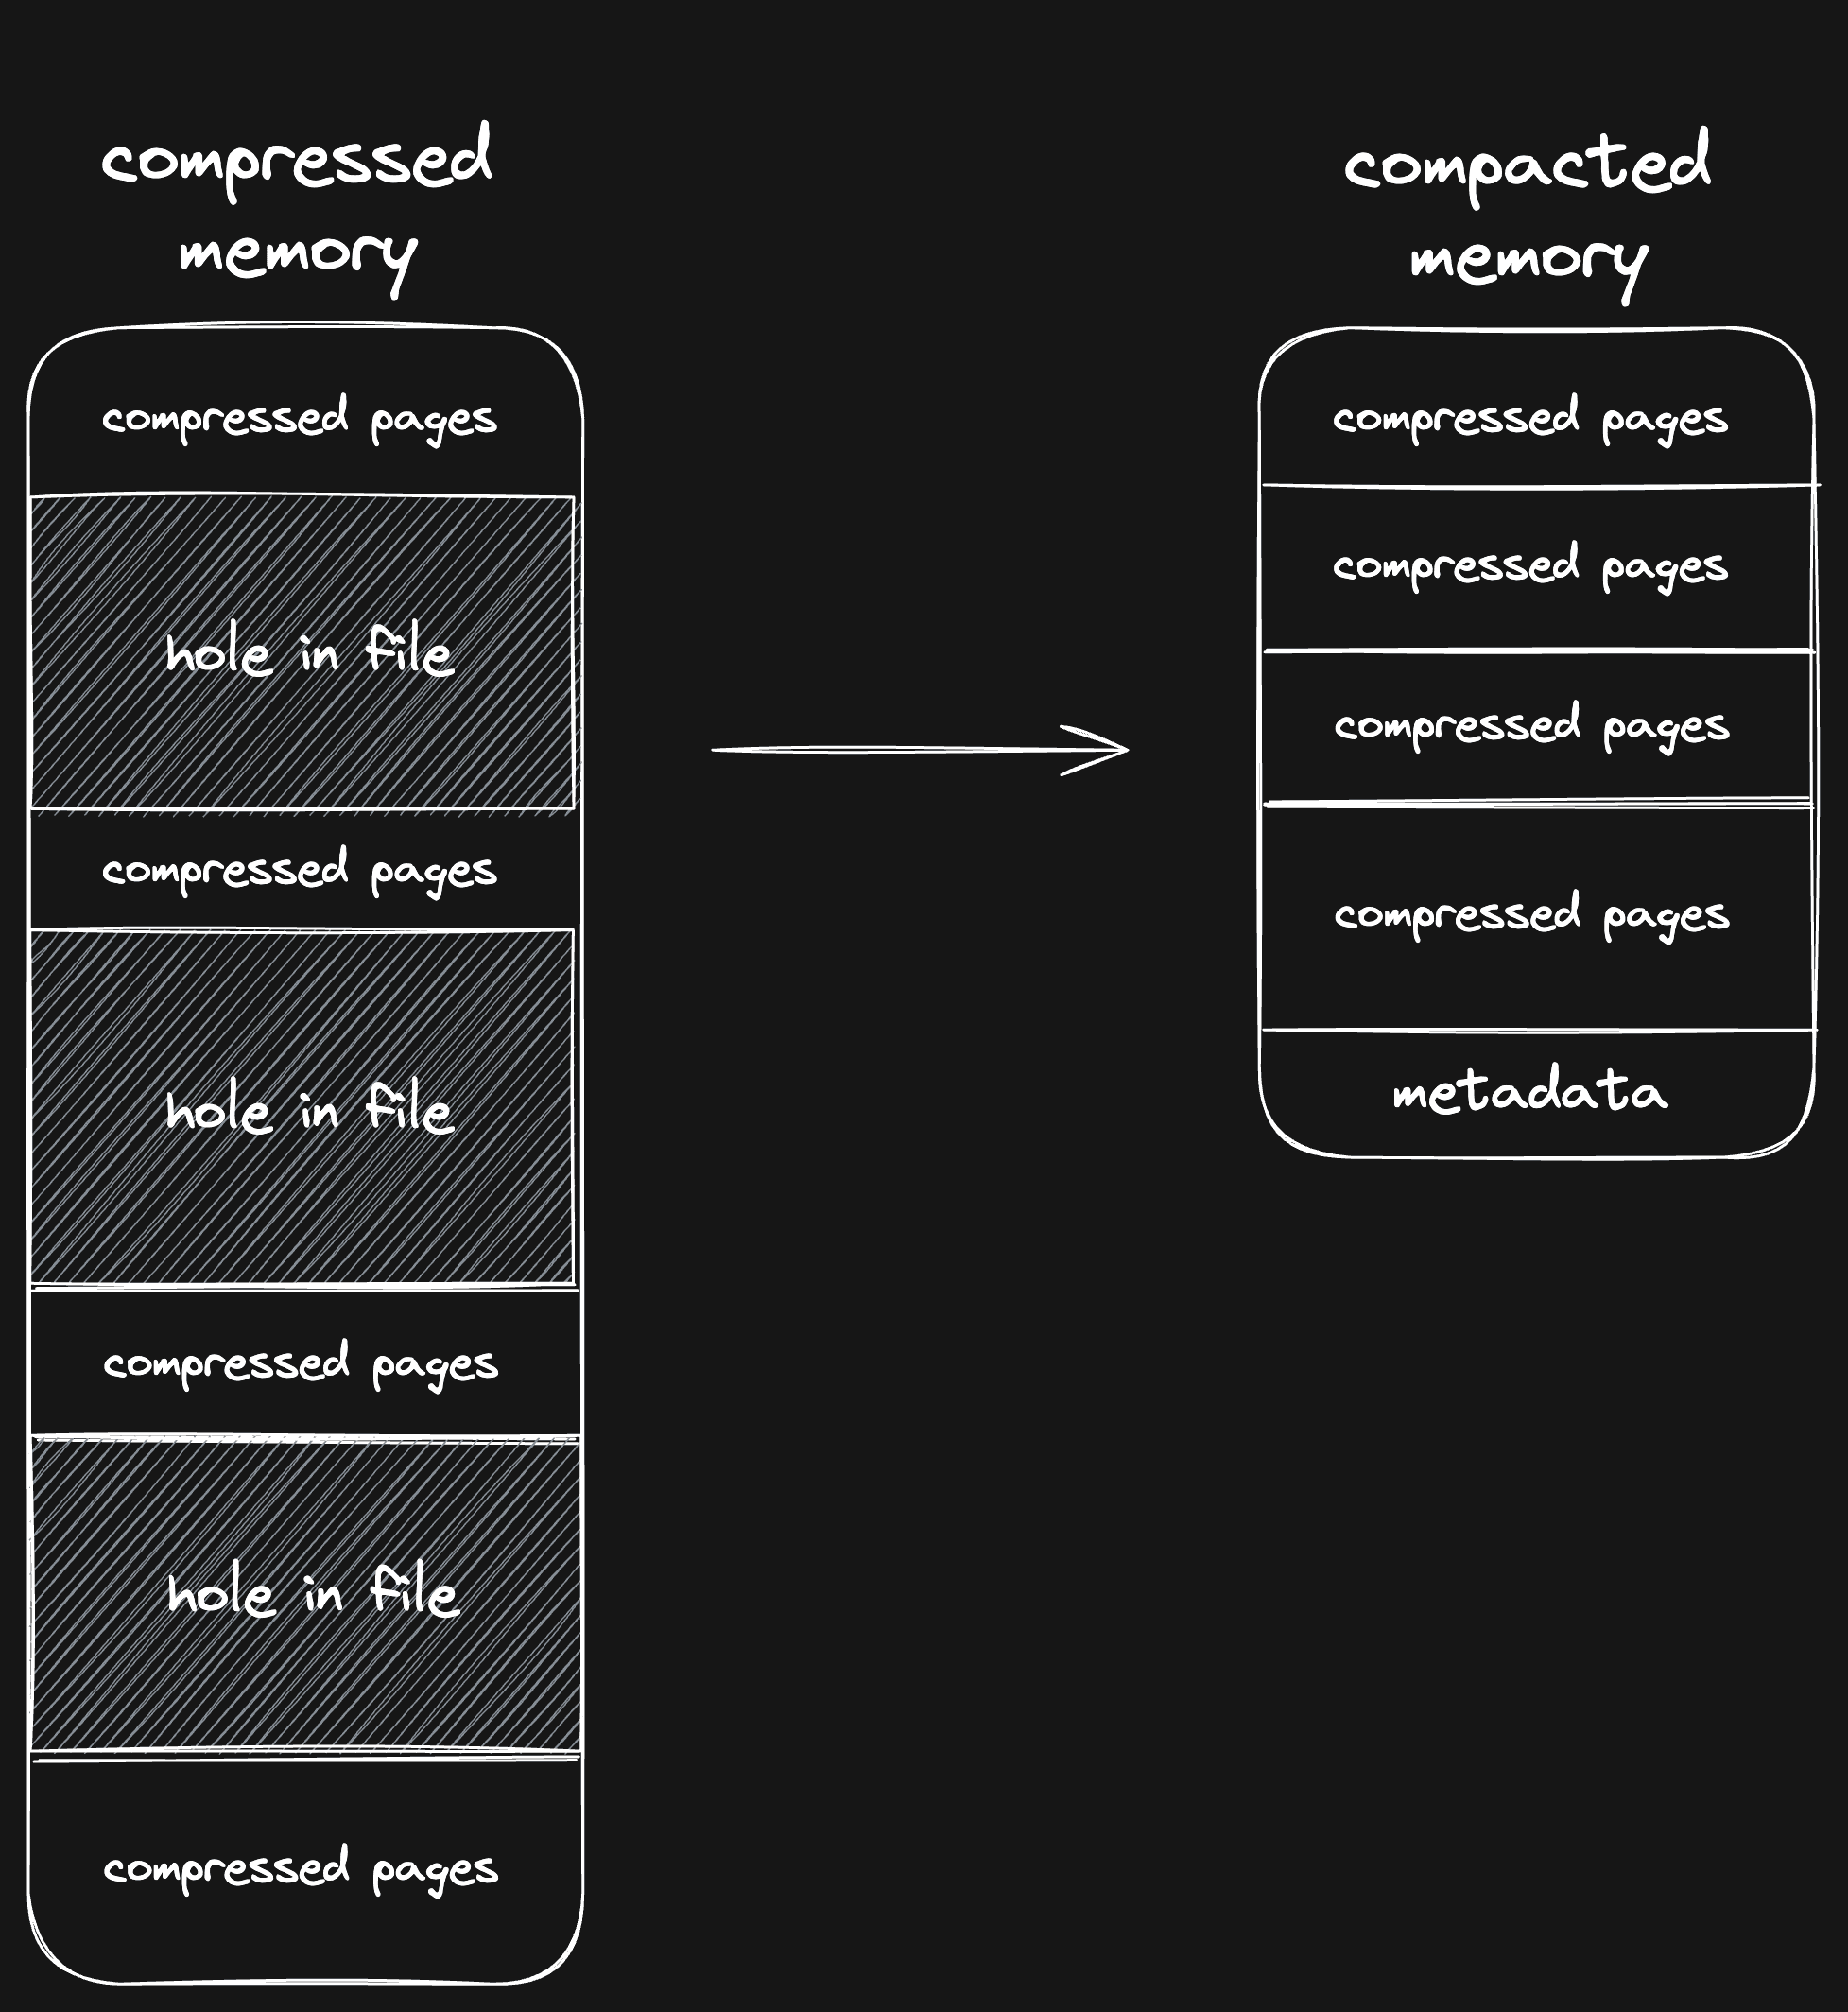
At the end of the memory snapshot (after the magic bytes UFFD), we store a manifest that outlines where every page is stored in the memory snapshot.
Why store the metadata at the end, instead of the start? It's to keep our memory snapshots backwards compatible with different uffd handler versions and memory snapshot formats.
The data structure looks like this (which also hints at some of our next optimizations):
#[derive(Debug, Serialize, Deserialize)]
pub(crate) struct MemoryInfo {
    /// For every page range, what is its serialized data
    pub(crate) page_info: Vec<PageInfo>,
    /// A zstd dictionary for dictionary compression
    pub(crate) zstd_dict: Option<Vec<u8>>,
    /// Whether this memory snapshot is saved sparsely, or concatenated
    pub(crate) is_compacted: bool,
    /// Which uffd handler version was used to save this snapshot
    pub(crate) uffd_handler_version: Option<String>,
}

#[derive(Debug, Serialize, Deserialize)]
pub(crate) struct PageInfo {
    pub start_page_idx: usize,
    pub end_page_idx: usize,
    pub backend_type: SerializationInfo,
}

#[derive(Clone, Debug, Serialize, Deserialize)]
pub(crate) enum SerializationInfo {
    /// Zeroed page
    Uninitialized,
    /// Page directly read from a file
    File,
    /// Compressed page read from a file, compressed using zstd
    ZstdCompressedFile { compressed_size_bytes: usize },
    /// Compressed page read from a file, compressed using lz4
    Lz4CompressedFile { compressed_size_bytes: usize },
}
The Uninitialized and File page types are always 4KiB, since they are not compressed. The ZstdCompressedFile and Lz4CompressedFile have their compressed size encoded. With this information, we can infer for every page at what offset they can be read from.
Desparsification (is that a new word?) reduced our VM resume times from 4s to 1s, a huge improvement!
Here's our same benchmark, applied to a compacted snapshot:
$ uffd-handler bench bench.json

metric: handle_read, count: 60099, total_time: 1.480032966s, avg: 24.626µs, min: 760ns, max: 7.405478ms
Average: 260.13MiB/s
Still there's a lot more that we can do to improve VM resume time.
Selective compression
As we've seen, memory snapshots are highly compressible. Compressing 8GiB to 745MiB is impressive, especially if we take into account that the file is compressed in 8KiB chunks.
However, if you look closely at all these compressed chunks, you'll notice that some chunks have an excellent compression ratio (99% space savings) and that other chunks are almost incompressible (1% space savings). In some cases, the compressed data even takes more space than uncompressed data.
To use this to our advantage, we've introduced a heuristic similar to btrfs. We first try to compress a chunk of memory and then check its compression ratio. Only if the compression ratio is good enough, we store the compressed chunk. If it's not good enough, we store the raw data. The code looks roughly like this:
/// Tries to compress the data, will return the compression type.
/// We don't compress the data if the resulting data is larger than the original data.
fn compress_data(
    data: &[u8],
    chunk_offset: usize,
    chunk_size: usize,
    compressor: &mut Compressor,
) -> io::Result<(SerializationInfo, Option<CompressedChunk>)> {
    let data = &data[chunk_offset..chunk_offset + chunk_size];
    let (compressed_data, serialization_info) = compressor.compress_with_info(data)?;
    let uncompressed_ratio = (compressed_data.len() / data.len()) * 100;

    // If the compressed data is at least 50% as big as the uncompressed data, save
    // the raw data instead (using `SerializationInfo::File`), otherwise store the
    // compressed data using the compression algorithm we just used (lz4 or zstd).
    if uncompressed_ratio >= 50 {
        Ok((
            SerializationInfo::File,
            Some(CompressedChunk::Uncompressed(chunk_offset, chunk_size)),
        ))
    } else {
        Ok((
            serialization_info,
            Some(CompressedChunk::Compressed(compressed_data)),
        ))
    }
}
In this case, if the compression ratio is over 50%, we store the raw data. This is a small trade-off: our memory snapshot will be larger, but our resume time will be faster.
This way, our memory snapshots become a bit larger (our example snapshot went from 725MiB to 921MiB), but our average resume times become faster.
Now this is an interesting result. When you look at our benchmark, you'll see that our decompression speed goes down (from 260MiB/s to 239MiB/s):
$ uffd-handler bench bench.json

metric: handle_read, count: 49458, total_time: 1.64950042s, avg: 33.351µs, min: 950ns, max: 9.296288ms
Average: 239.21MiB/s
That's because we need to read more data from the disk if we don't compress everything, and it seems like the filesystem is the bottleneck on our test server.
Still, we decided to keep this change. The benchmark ultimately does not reflect the real situation, because it runs on an idle server. When we deployed this change to production, we actually did see a drop in average resume times, especially during busy hours. That's because with this change, the server spends less compute on decompressing, which was the bottleneck around those times.
All in all, the compression ratio threshold is a lever that allows us to tweak compute vs IO and storage.
Skipping zeroes
There's one additional optimization we can do when compressing pages. In many cases, a VM will not initialize all its memory. This means that a lot of memory will just be zeroes. It's a shame to compress or save that data, so when we persist memory, we account for that by literally checking if the current chunk is all zeroes:
let is_all_zeroes = data.iter().all(|&b| b == 0);
if is_all_zeroes {
    return Ok((SerializationInfo::Uninitialized, None));
}
This way, we don't have to compress and save chunks that don't contain any data. In fact, we're not saving anything at all!
Thanks to our recently introduced metadata, we can store for every page whether it's compressed, raw (File), or uninitialized (Uninitialized). When reading memory, we can use this information to determine how to initialize it.
If you have read the previous
post, you'll
know that there is one more data source called Vm. This is used in VM
cloning so the child knows to read its memory from the parent.
This improvement is effective for “fresh” VMs: VMs that have started and haven't run for a long time. Unfortunately it doesn't do much for long-running VMs, let's dive into why.
Memory reclamation
Skipping uninitialized memory (is_all_zeroes) is a great optimization, but not as effective as you might think. That's because Linux zeroes memory lazily.
When you initialize some memory, write a lot of bytes to it, and then free the memory, Linux does... nothing. Well, it does sort of something: it updates its internal administration. But it does not clear the memory. What you have written to that memory stays there until that memory gets allocated again in the future. Only then it will be zeroed.
This is an optimization. Since 2019, it can be disabled. This is more secure (less chance of kernel bugs leading to leaked memory), but it also has a performance impact, as it now needs to write zeroes to memory every time it is freed.
Because of this, there is a lot of cruft inside the memory of a VM. Let's say you start a process that uses a lot of memory (like Webpack), and kill it. When running htop it will seem like your memory is squeaky clean, but when we create a snapshot it will look like all memory is being used.
The impact of this is significant, both for memory size (we're compressing bytes that won't be used) and for loading time (we're decompressing memory that Linux will ultimately zero out anyway). Especially for long-running VMs, this made VM starts slower than they should be.
We solved this by introducing memory reclamation, which we can do with a memory balloon. Firecracker can run a device called a “memory balloon” in every VM. The main purpose of a memory balloon is to reserve memory (by inflating), and communicate back to the host (where we run the VM) how much memory is free, used and reserved. This allows you, as a host, to control how much memory VMs use.

When we hibernate a VM, we also inflate the balloon to its maximum possible size before taking a snapshot to make sure that the page cache gets cleared. Another optimization for memory snapshot size.
Initially, memory balloons were primarily used to control memory usage inside a VM using its deflate/inflate functionality. Later on, a new feature was added to the memory balloon called “Free Page Reporting”. That's the feature we need. With this feature, the memory balloon keeps track of when memory is freed by Linux, which it then reports back to the host.
This is perfect for us! We can configure the memory balloon to report freed pages back to us, and with that information we know which memory pages don't have to be saved when persisting.
Firecracker itself supports the memory balloon but not free page reporting. With this commit I've added this functionality.
This functionality is not just important for our snapshots. If we don't keep track of freed memory, the memory usage of a VM can only grow, but never shrink. It's the same problem we have with persisting memory: when Linux reserves some memory and then frees it, we don't know on the host whether that memory is still used. Because of this, we can never free that memory on the host, and the memory usage of a VM will only grow. This article highlights this problem.
But thanks to free page reporting, that is solved! We're smashing two flies with one clap here (this is the literal translation of a Dutch saying, so bear with me): we get more efficient memory usage and our memory snapshots become smaller!
Freeing memory based free page reporting is also called "memory reclamation".
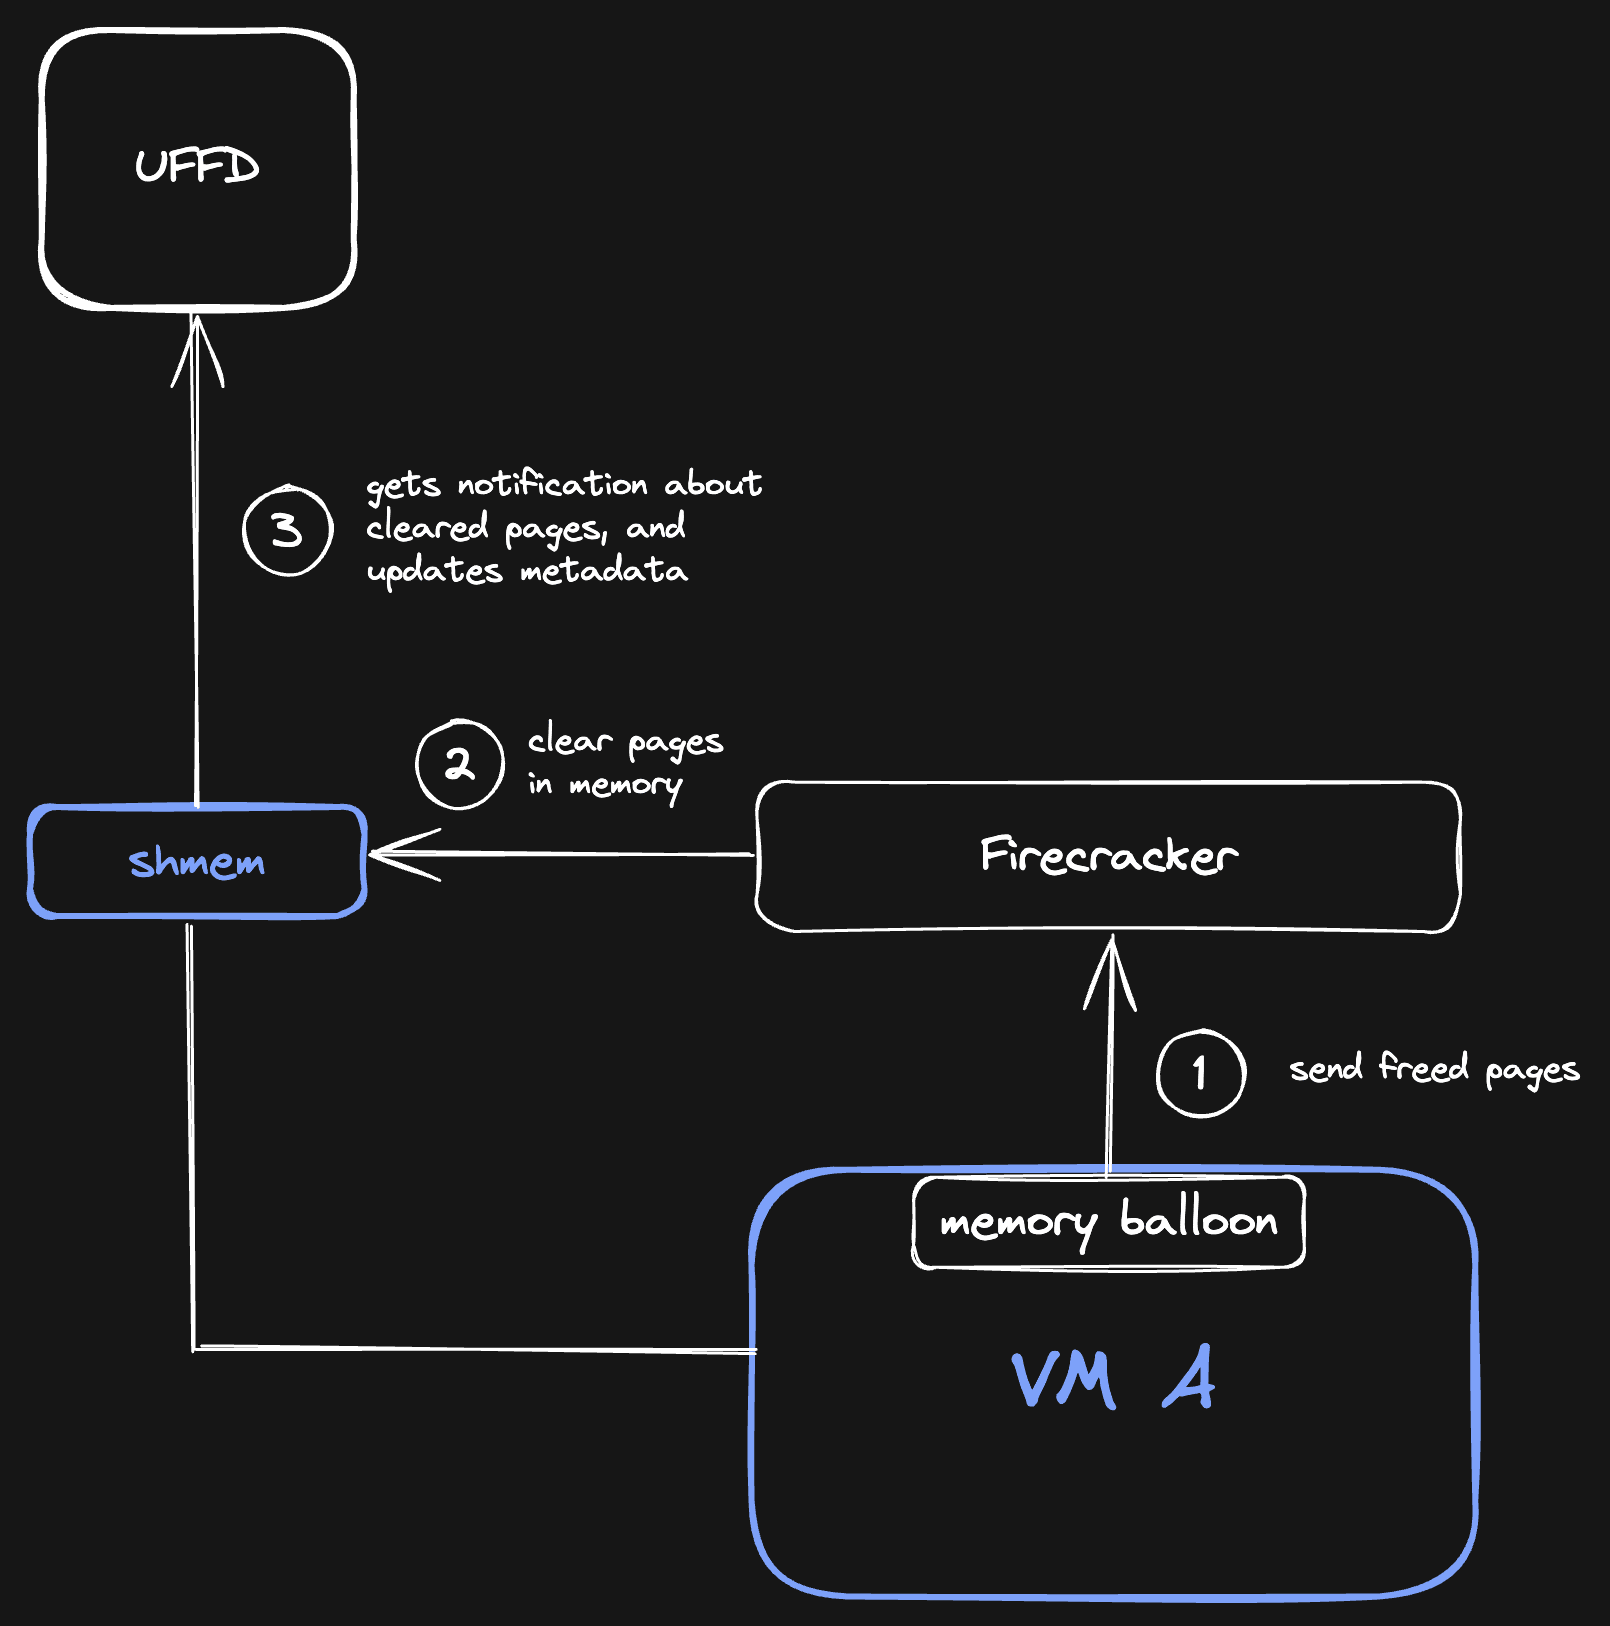
So this is how it works: whenever the memory balloon reports to Firecracker that Linux has freed some memory pages, Firecracker will free that memory. Our userfaultfd handler listens to these memory frees, and will mark those pages as Uninitialized. Now, when we persist that memory, those pages will take up 0 bytes inside the memory snapshot!
Even though those pages might still have data in the VM, Linux doesn't care what happens to them because they need to be zeroed anyway the next time they are allocated. This is why we don't have to store those pages.
Final inspection
So let's look at a memory snapshot of one of our most popular VMs (Next.js template). This VM has been running now for 1 hour, and approximately 4000 people visited the dev server in that time. This is the metadata of the snapshot:
$ uffd-handler inspect-memory --summarized memory.snap
Memory size: 1496.64 MiB
Metadata size: 9820.25 KiB
Metadata load time: 37.780484ms

Summary:
  Lz4CompressedFile   : 527035   (2.01GiB) (compressed 587.04MiB - 0.29x)
  Uninitialized       : 3434412  (13.10GiB)
  File                : 232857   (909.60MiB)

00000000 - 00000002: Lz4CompressedFile    (2     =8.00KiB   ) (compressed 74B - 0.01x)
00000002 - 00000006: Uninitialized        (4     =16.00KiB  )
00000006 - 00000008: Lz4CompressedFile    (2     =8.00KiB   ) (compressed 121B - 0.01x)
00000008 - 00000010: Lz4CompressedFile    (2     =8.00KiB   ) (compressed 47B - 0.01x)
00000010 - 00000012: Lz4CompressedFile    (2     =8.00KiB   ) (compressed 2.82KiB - 0.35x)
00000012 - 00000032: Uninitialized        (20    =80.00KiB  )
00000032 - 00000034: Lz4CompressedFile    (2     =8.00KiB   ) (compressed 567B - 0.07x)
00000034 - 00000152: Uninitialized        (118   =472.00KiB )
00000152 - 00000154: File                 (2     =8.00KiB   )
00000154 - 00000156: Lz4CompressedFile    (2     =8.00KiB   ) (compressed 324B - 0.04x)
00000156 - 00000158: Lz4CompressedFile    (2     =8.00KiB   ) (compressed 389B - 0.05x)
00000158 - 00000160: Lz4CompressedFile    (2     =8.00KiB   ) (compressed 1.31KiB - 0.16x)
00000160 - 00004095: Uninitialized        (3935  =15.37MiB  )
... cutting the rest off ...
The memory of the VM itself is 16GiB, and inside the VM we limit it to 4GiB for the user (which enables us to do hot resizing of memory inside the VM). You can see that if we were to store all data raw, the snapshot would be 3GiB, but after compression it's 1.5GiB. Also, because we don't save uninitialized or empty memory, we don't have to store 13.5GiB of the memory snapshot to disk.
What didn't work
There are some other things we tried that didn't result in an improvement. Here are some of those things:
We tried compressing memory snapshots with zstd, using dictionary compression to optimize size and speed. Unfortunately, in our test cases, this was on par with the decompression speed of lz4.
We also tried to do predictive decompression. We'd predict which memory pages would be read next by the VM, and eagerly decompress those pages. Unfortunately, this introduced synchronization between threads on every decompression, which was a performance penalty that resulted in negligible improvements in resume speed.
Conclusion
All in all, these optimizations allowed us to scale our VM infrastructure while maintaining a good performance in resume speed. We're still able to resume a VM in 400ms on average, with a P99 of 2s and a P01 of 150ms:
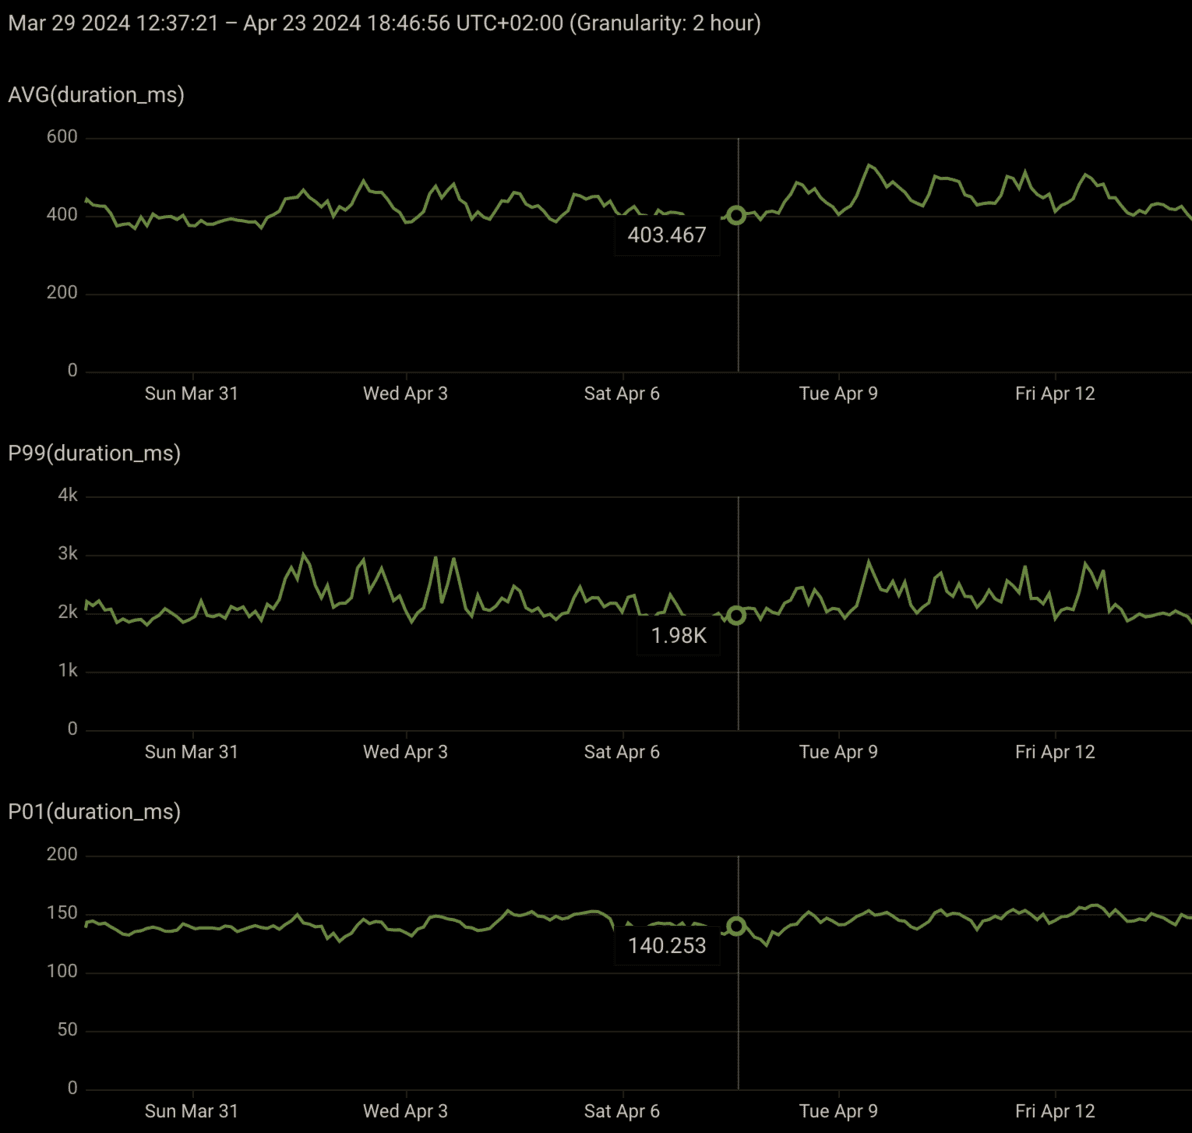
There's a lot more that we can do to improve these resume times, but as it stands today can comfortably run this with ~2.5 million VM resumes per month, which is a huge improvement over the scale we used to support. Today, memory snapshots are no longer a bottleneck for scaling our infra.
There's also a lot more that we can do in this space. For example, I still want to experiment with loading memory over the network, from a server. That would allow us to do "live migration": move a VM from one server to another without downtime. This could potentially be a huge cost saver, because it would allow us to run workloads on spot instances (servers that the hosting provider can claim back at any time), which are up to 90% cheaper.
If you have any questions, feedback or ideas, don't hesitate to send me a DM. Also it's super easy to try out this functionality yourself by creating a new Devbox (which is a VM running a dev environment) from our dashboard.
I'm really looking forward to expanding this series in the future!


